The map below is a part of a suitability analysis that was done looking at the Keystone XL pipeline in Nebraska. It is in vector format. It examines several environmental and demographic factors that would be affected if the pipeline was to be built. (Note: The first three maps were used as part of a group project, but the cartography is done by me.)
Below is the same data converted to raster format. This allows for the data to be used in a suitability analysis. Many of the factors were examined using multi-ring buffers where areas closer to the factor were considered to be more vulnerable.
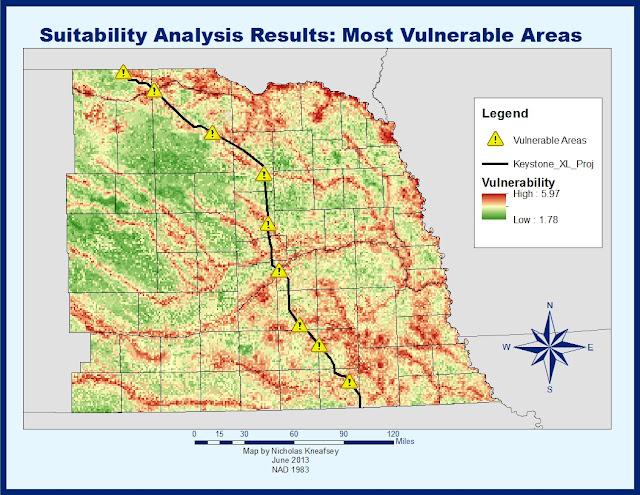
Below is the suitability analysis done from the maps above. The shapefile of the pipeline was then placed over the suitability analysis. From this, it is clear where the most vulnerable areas intersect with the pipeline. These points are shown on the map by the yellow triangular sign with the exclamation point.
This is a map that shows where existing and proposed cellular towers are in four counties in Southern California. Using this map, we can see the areas that have cellular towers and what areas need greater cell service.
This is a viewshed analysis that looks at cell coverage in Los Angeles County and the benefits of increasing cell tower height by ten meters, tower coverage by five kilometers, or adding three additional towers. Increasing the tower range proved to give the greatest increase in coverage. Elevation is also shown on the map to show the way that elevation affects coverage.
Below is a Watershed Analysis for the Tibetean Plateau. Both Basins and Stream order are calculated. This shows where rivers would flow based on the topography of the plateau. This skill is important for understanding where water would go should there be a flood.
This is a network analysis that examines the service area for golf courses in Los Angeles. This shows the areas in West Los Angeles that are within five and ten minutes of a golf course. Network analysis is important for determining the service areas for businesses so that the business owner can understand how accessible their business location is based on road networks.
This is a map that finds the closest route from several different fictional homes with theoretical point, line, and area barriers. This skill is important for finding the quickest route to a certain place when there are restrictions such as traffic, road work, or disasters.
Thanks for viewing!


No comments:
Post a Comment